
This report gives a simple and neutral review of Aditya Infotech from the chart and the market data supplied in the question. It covers price action, major price levels, moving averages, RSI, MACD, volume, VWAP, volatility, valuation, and recent return data. It also explains the main risk areas that may matter to a market participant.
This report is for analysis and educational use only. It is not a call to buy, sell, or hold the stock. No future result can be assured from a chart, an indicator, a valuation ratio, or past return data. The view here relies only on the data shown by the user. A full investment review would also need company results, cash flow, debt, profit growth, management quality, sector conditions, and other facts that are not part of the supplied material.
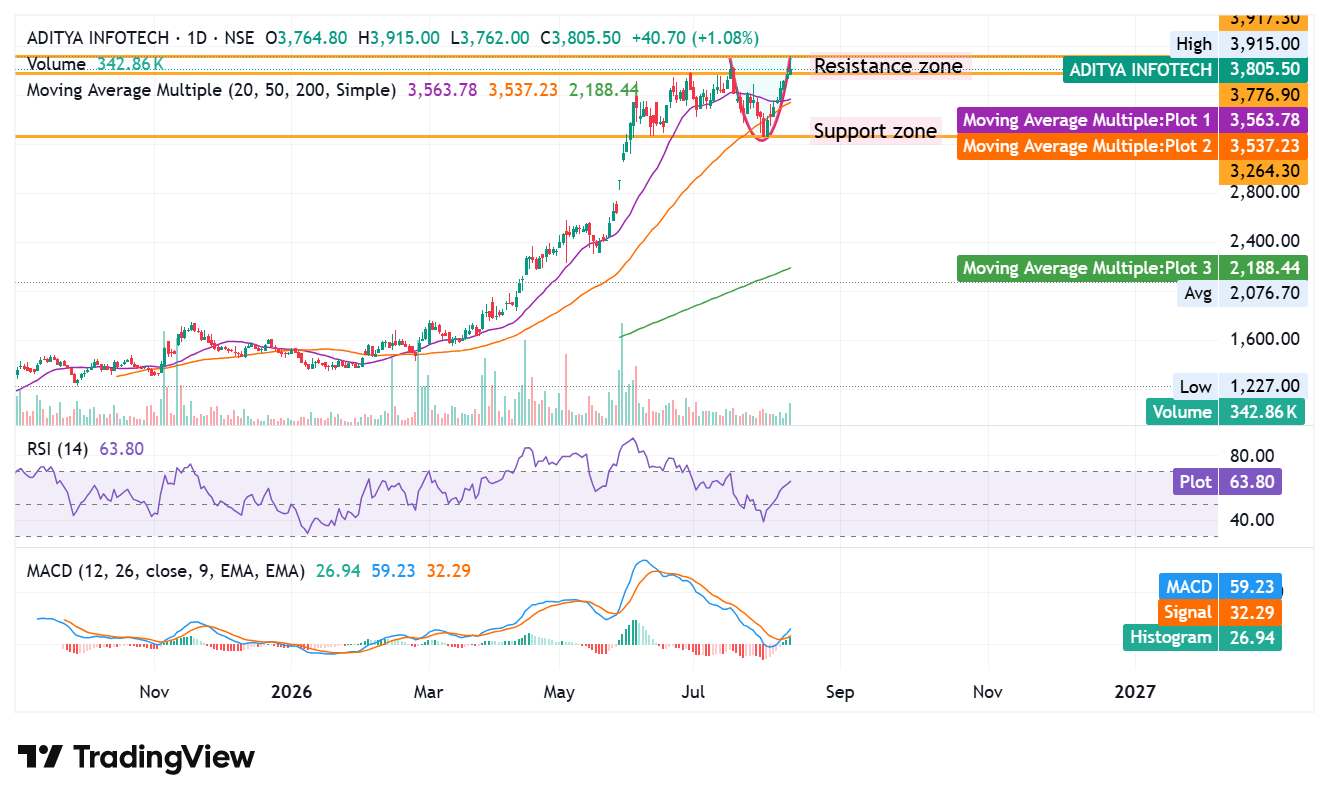
Price position and daily action
Aditya Infotech closed at ₹3,805.50 on the date shown in the chart. The prior close was ₹3,764.80, so the stock rose by ₹40.70, or 1.08%, for the day. The open was also ₹3,764.80. The day high was ₹3,915.00, while the day low was ₹3,762.00.
The daily range was therefore wide. The stock moved from ₹3,762.00 to ₹3,915.00 and then ended at ₹3,805.50. This matters because the stock reached the same level as its stated 52-week high of ₹3,915.00, but it did not hold that level at the close.
That price action can suggest the presence of supply near ₹3,900 to ₹3,915. It does not by itself prove a reversal. The broader trend still looks positive. A few sessions after a high test would give more evidence on whether the market can accept prices above that zone.
| Price item | Value |
|---|---|
| Prev. Close | ₹3,764.80 |
| Open | ₹3,764.80 |
| High | ₹3,915.00 |
| Low | ₹3,762.00 |
| Close | ₹3,805.50 |
| VWAP | ₹3,854.12 |
| 52 Week High | ₹3,915.00 |
| 52 Week Low | ₹1,045.55 |
| Upper Band | ₹3,953.00 |
| Lower Band | ₹3,576.60 |
| Price Band | 5% |
| Tick Size | ₹0.10 |
Major resistance zone
The clearest resistance area on the chart is near ₹3,915.00. This is also the stated 52-week high for 11-Aug-2026. The upper price band is ₹3,953.00. The current close of ₹3,805.50 is about 2.9% below the 52-week high and about 3.9% below the upper band.
This means the stock is close to a major price test. A close above ₹3,915 could be a positive technical event, but a single move above that level should not be treated as proof of a durable breakout. A stronger signal would be a firm daily close above the level, with good volume and some follow-through in later sessions.
The chart also shows a marked resistance zone near this area. Since the stock has already had a very large rise over the past year, a failure near the prior high may lead to a pause or a price correction. Such a move would not automatically mean that the larger trend has changed.
Key support levels
The first short-term support area appears near ₹3,776.90, as shown on the chart. This level is close to the present market price. A close below this area could weaken the immediate price setup and may lead the market to test lower levels.
The stronger support area comes from the 20-day and 50-day averages. The chart shows ₹3,563.78 for the 20-day average and ₹3,537.23 for the 50-day average. These two levels are close to each other and create a useful support band around ₹3,535 to ₹3,565.
The stock is far above the 200-day average of ₹2,188.44. Therefore, a fall to the 20-day or 50-day average would still leave the price well above the long-term average. A deeper break below the 20-day and 50-day area would, however, weaken the current medium-term structure.
Trend and average price structure
The chart has a clear upward structure. The current price of ₹3,805.50 is above all three major averages shown in the chart.
| Price measure | Value | Relation to close |
|---|---|---|
| Close | ₹3,805.50 | — |
| 20-day average | ₹3,563.78 | Below price |
| 50-day average | ₹3,537.23 | Below price |
| 200-day average | ₹2,188.44 | Far below price |
This order is constructive from a technical point of view. The short-term average is above the medium-term average, and both are far above the long-term average. This type of structure is often linked with a strong upward trend.
At the same time, the distance from the 200-day average is very large. The current price is about 74% above the 200-day average. That does not mean that a fall must occur, but it does show that the stock has moved far from its long-term average. In a stock with such a large prior rise, sharp price swings can occur even when the larger trend remains positive.
RSI and price momentum
The chart shows RSI (14) at 63.80. RSI is a momentum measure. A level above 50 often supports a positive price view, while a level near 70 or above can indicate a strong or stretched market.
At 63.80, RSI is positive but not at a classic overbought level. This means the momentum data does not show an extreme reading at the time of the chart.
The main point to watch is the relationship between price and RSI near the recent high. If the price makes a new high while RSI fails to make a similar high, that may suggest weaker momentum. Such a pattern is only a warning sign. It is not, on its own, proof of a price decline.
MACD view
The chart shows the following MACD data.
| MACD item | Value |
|---|---|
| MACD | 59.23 |
| Signal | 32.29 |
| Histogram | 26.94 |
The MACD is above the signal value, and the histogram is positive at 26.94. This gives a positive momentum signal on the chart.
The recent MACD path also shows a recovery after a prior decline. That pattern is consistent with the recent price recovery from the support area. As with RSI, MACD does not predict the future with certainty. It is best used as a part of the wider price and volume picture.
VWAP and short-term price position
The session VWAP was ₹3,854.12. The close was ₹3,805.50, which was below VWAP.
This gives a mild short-term caution. The stock rose on the day, but the final price was below the volume-weighted session average. That can mean that some supply remained near the higher part of the day’s range.
A return above ₹3,854 could improve the very short-term setup. A move above VWAP alone, however, should not be treated as a major trend signal. The larger levels near ₹3,776 and ₹3,915 remain more important for chart analysis.
Volume and market activity
The supplied data shows traded volume of 3.43 lakh shares and traded value of ₹132.14 crore. The deliverable quantity was 50.52% of traded quantity.
The volume figure is useful, but it must be judged against prior volume near other major price highs. A price move above ₹3,915 with a clear rise in volume would offer stronger evidence than a breakout on low activity. At present, the supplied data does not give enough historical volume comparison to prove such a pattern.
The impact cost is 0.11, which suggests a relatively modest transaction impact under the stated market measure. The applicable margin rate is 100.00%. These figures are market data points and should not be read as proof of future liquidity or price stability.
Return profile
The stock has produced very large gains over the periods shown in the supplied data.
| Period | Price return shown |
|---|---|
| 1W | +8.31% |
| 1M | +3.48% |
| YTD | +149.01% |
| 1Y | +256.35% |
| 3Y | 0.00% |
| 5Y | 0.00% |
The +149.01% YTD result and +256.35% 1Y result are particularly notable. Such returns can attract more market attention, but a strong past return does not establish a similar future return.
The zero values for 3Y and 5Y should also be read in the context of the listing date. The supplied securities data states that Aditya Infotech was listed on 05-Aug-2025. Therefore, there is not a long listed price record that can support a normal three-year or five-year comparison.
Volatility and risk
The stock has a Daily Volatility of 2.35 and an Annualised Volatility of 44.90. Those figures show that the stock can have fairly large price moves.
High volatility can create both faster gains and faster losses. A 5% to 10% price move can occur with much less surprise in a stock with elevated volatility than in a low-volatility company.
This is important because the current price is close to a major high. A failed breakout could result in a quick price correction. At the same time, high volatility can also make a valid breakout move very fast. For that reason, price size and position size deserve close attention in any personal risk plan.
Valuation and fundamental caution
The stated Symbol P/E is 120.58, and the Adjusted P/E is also 120.58. This is a high earnings multiple.
A high P/E can reflect strong market expectations for future earnings, strong growth prospects, scarcity value, or other market factors. It can also raise the risk of a large price response if future results do not match those expectations.
The supplied data does not provide enough detail on future earnings growth, profit margin, free cash flow, debt, or return on capital. For that reason, the P/E should not be used alone to call the stock cheap or expensive in absolute terms. It is better viewed as a clear sign that valuation risk deserves attention.
ALSO READ: Capri Global Capital Stock Analysis and Outlook 2026
Market value and share details
The total market capitalisation is ₹44,665.33 crore, while the free float market capitalisation is ₹10,214.65 crore. The face value is ₹1.00. The stock is part of the NIFTY 500 and the stated basic industry is Industrial Products.
| Item | Value |
|---|---|
| Total Market Cap | ₹44,665.33 Cr. |
| Free Float Market Cap | ₹10,214.65 Cr. |
| Face Value | ₹1.00 |
| Index | NIFTY 500 |
| Basic Industry | Industrial Products |
| P/E | 120.58 |
| Adjusted P/E | 120.58 |
| Listing Date | 05-Aug-2025 |
The stock status is Listed and the market status is Active. The upper band is ₹3,953.00, while the lower band is ₹3,576.60. The price band is 5%.
A simple scenario view
The current setup can be read through three broad price cases. These are scenarios, not forecasts.
| Scenario | Key price area | Simple interpretation |
|---|---|---|
| Positive case | Above ₹3,915 | Possible breakout test |
| Neutral case | ₹3,775 to ₹3,915 | Possible range and pause |
| Weak case | Below ₹3,775 | Higher chance of support test |
| Major trend risk | Below ₹3,535–₹3,565 | Medium-term structure may weaken |
A firm close above ₹3,915, with strong volume, would be the clearest positive chart event. The next stated reference is ₹3,953, the upper band.
A price range between ₹3,775 and ₹3,915 would suggest a pause near the recent high. Such a phase could allow the short-term averages to move closer to the price.
A break below ₹3,775 would raise the chance of a test of the ₹3,535 to ₹3,565 area. That zone is especially important because it sits close to both the 20-day and 50-day averages.
Final assessment
Based only on the supplied chart and data, Aditya Infotech has a strong bullish technical structure, but it also has clear risk factors. Price is above the 20-day, 50-day, and 200-day averages. RSI at 63.80 remains positive without an extreme reading. MACD at 59.23 is above its signal value of 32.29, and the histogram is positive at 26.94.
The main short-term issue is the resistance zone near ₹3,915 to ₹3,953. The stock reached ₹3,915.00 but closed at ₹3,805.50, below both the day high and VWAP of ₹3,854.12. This shows that the high area still has supply.
The main medium-term support area is ₹3,535 to ₹3,565, while ₹3,775 is the nearer level to watch. A clear break of these levels could change the technical view.
The larger caution comes from the stock’s very strong past return, its 44.90% annualised volatility, and its 120.58 P/E. Those figures do not make the stock negative by themselves, but they do suggest that the market may have high expectations and that price risk can be high.
In simple terms, the supplied data shows a stock with a strong upward trend that is now close to a major price test. The next clear signal would come from the stock’s response to ₹3,915 and ₹3,953, while ₹3,775 and ₹3,535–₹3,565 remain important lower levels. Any personal investment decision should take account of risk capacity, valuation, company fundamentals, and new market data that may appear after the date of this chart.
Disclaimer: This content is for educational and informational purposes only and should not be considered investment advice, a recommendation, or a solicitation to buy or sell any security. Market prices and conditions can change rapidly, and past performance does not guarantee future results. Please conduct your own research and consult a qualified financial adviser before making any investment decision.
ALSO READ: Q&T Foods IPO: Price, Timeline, Key Details