
This report gives a simple technical review of the Hindustan Zinc Ltd. (HINDZINC) daily chart shown in the image. It uses only the price data, moving averages, Fibonacci levels, RSI, MACD, volume, and trend lines visible on the chart.
This is an analytical view of the chart, not a promise of future price movement. It is also not personal investment advice, a recommendation to buy or sell, or a statement about the future value of the stock. Market prices can move in either direction, and actual results can differ from any chart-based view.
The chart has a date stamp of September 03, 2026, at 10:04 AM UTC+5:30. The chart shows HINDZINC on a 1-day time frame. The price data visible on the chart is Open ₹593.00, High ₹599.00, Low ₹592.00, Close ₹593.20. The daily change shown is +₹4.80, or +0.82%.
Current Price Position
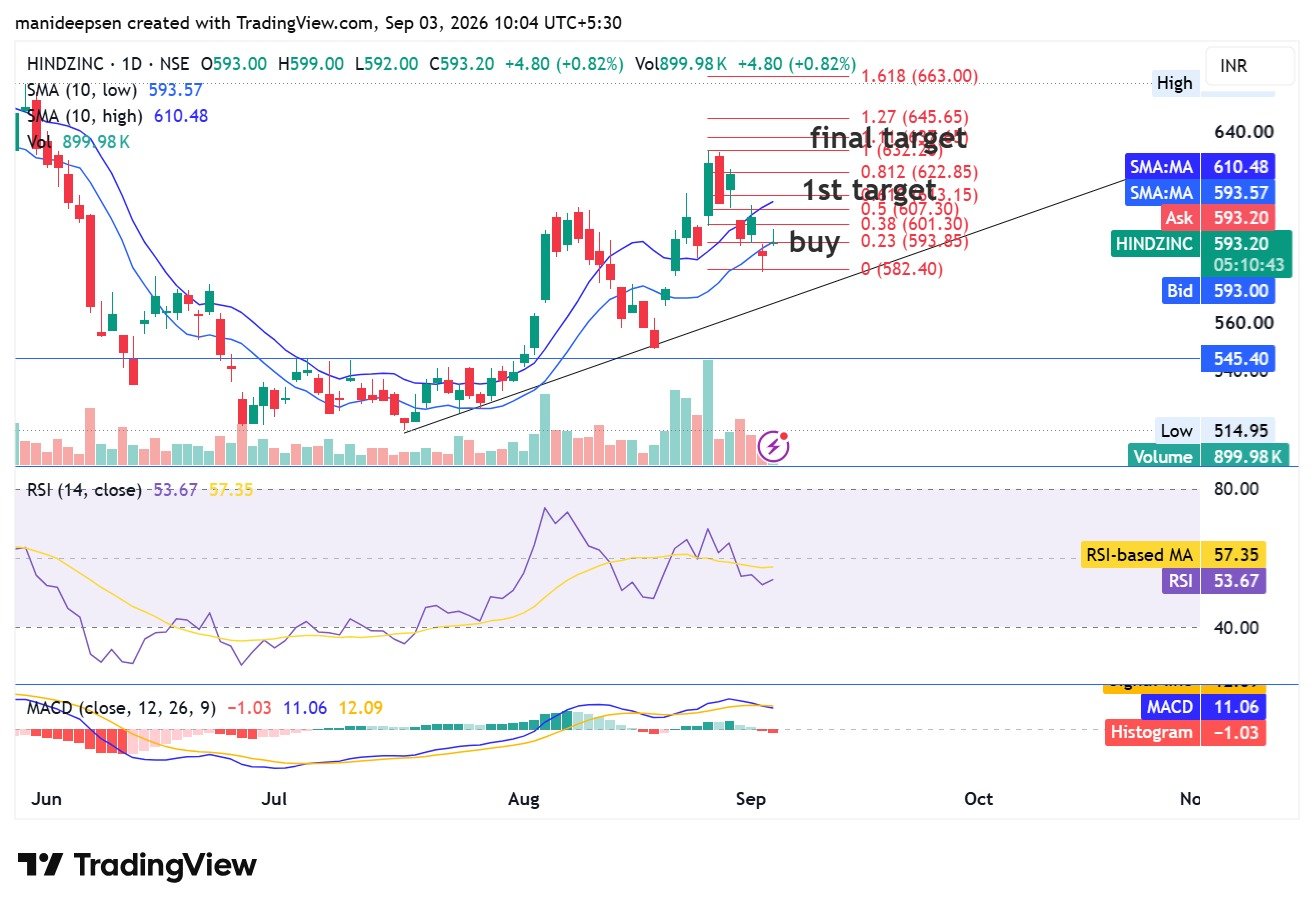
HINDZINC has a close of ₹593.20. The price sits close to the 10-day simple moving average of ₹593.57. The difference is only about ₹0.37, so the current price is almost at the same level as this short-term average.
The chart also shows a 10-day high moving average at ₹610.48. This level is above the current price and can act as a short-term resistance area if price moves higher.
The recent chart structure shows a rise from the lower levels seen during July and August. After that rise, the price reached an area near ₹630–₹635 and then moved lower. The latest candles show a pause after that decline.
This creates a mixed but still constructive picture. The larger price structure on the chart looks positive, while the very short-term momentum is less strong.
| Chart item | Value |
|---|---|
| Open | ₹593.00 |
| High | ₹599.00 |
| Low | ₹592.00 |
| Close | ₹593.20 |
| Daily change | +₹4.80 |
| Daily change % | +0.82% |
| 10-day SMA | ₹593.57 |
| 10-day High SMA | ₹610.48 |
| Volume | 899.98K |
Trend Structure
The price action from July into August shows a clear recovery from lower levels. The stock first formed a base in the lower price area and later moved higher. The chart then showed a stronger upward move during August.
A rising trend line is also visible below the recent price action. This line connects important lower points and gives a simple view of the broader support structure.
At present, the price remains above the major support zone at ₹582.40. As long as this level holds on a daily closing basis, the broader positive structure shown by the chart remains valid from a technical perspective.
This does not mean that price must rise. It only means that the chart has not yet shown a clear failure of the current upward structure.
A move below ₹582.40 would change the technical picture. A sustained fall below that level could signal that the recent upward structure has lost strength.
Fibonacci Price Levels
The chart contains several Fibonacci levels. These levels help define areas where price may face support or resistance. They should not be treated as exact points at which price must reverse.
The main levels shown on the chart are as follows.
| Fibonacci level | Price | Technical role |
|---|---|---|
| 0% | ₹582.40 | Key support |
| 23.6% | ₹593.85 | Current decision zone |
| 38.2% | ₹601.30 | First resistance |
| 50% | ₹607.30 | Important resistance |
| 61.8% | ₹613.15 | Strong resistance area |
| 81.2% | ₹622.85 | Higher resistance |
| 100% | Around ₹632 | Prior high zone |
| 127% | ₹645.65 | Extension level |
| 161.8% | ₹663.00 | Higher extension level |
The current close of ₹593.20 is slightly below the 23.6% level at ₹593.85. This makes ₹593–₹594 an important short-term area on this chart.
If price stays near this zone and then moves above ₹601.30, the next major areas on the chart are ₹607.30 and ₹613.15.
A move above ₹613.15 would show stronger price acceptance above the first group of resistance levels. The next important area would then be around ₹622.85.
Above the prior high zone near ₹632, the chart shows Fibonacci extension levels at ₹645.65 and ₹663.00.
These are mathematical chart levels. They are not forecasts or guaranteed targets.
The ₹593 Area
The ₹593–₹594 area is one of the most important parts of the chart at present.
There are several reasons for this. The current close is ₹593.20. The 10-day SMA is ₹593.57. The 23.6% Fibonacci level is ₹593.85. These values sit very close to one another.
When several technical references sit close together, that price zone can become more important for short-term analysis.
If the price holds this area and later moves above ₹601.30, the chart could show a return of short-term upward pressure.
If the price fails to hold this area, the next important level is ₹582.40. Therefore, the space between ₹593 and ₹582.40 is important for risk assessment.
The chart alone cannot confirm whether a support level will hold. A daily candle close, volume, and the next few price sessions would provide more information.
Resistance Near ₹601 to ₹613
The first important resistance area starts at ₹601.30. This is the 38.2% Fibonacci level shown on the chart.
The next level is ₹607.30, which is the 50% Fibonacci level. The chart also shows the 10-day high SMA at ₹610.48, which adds another reference close to this area.
The ₹610–₹613 region therefore deserves attention. The 61.8% Fibonacci level is ₹613.15.
If price reaches this zone, a failure to move higher could result in another short-term pullback. On the other hand, a strong daily close above this area could show better short-term strength.
The distinction is important. A brief move above a level is not the same as a sustained move above it. A technical analyst would normally look for price confirmation rather than rely on one intraday move.
Higher Price Levels
Above the ₹613.15 area, the next Fibonacci level visible on the chart is ₹622.85.
The chart also shows a prior high area near ₹632. This zone may have greater importance because it represents a previous area of price strength.
If price moves above that prior high zone with strong volume, the chart’s Fibonacci extension levels become relevant. The first extension is ₹645.65, while the 161.8% extension is ₹663.00.
It is important to describe these levels correctly. They are potential technical reference points, not assured price targets.
The fact that a chart displays ₹645.65 or ₹663.00 does not mean HINDZINC will reach either level. Price could reverse before reaching them, remain in a range, or move below support.
Support at ₹582.40
The ₹582.40 level is the main support level visible in the Fibonacci structure.
This level is especially important because it is below the current price but still close enough to matter for the current setup.
A daily close below ₹582.40 would weaken the present bullish structure. If price remains below this level for a sustained period, the chart could shift from a positive structure toward a weaker one.
The next major support visible on the chart is around ₹560. Another important horizontal support is marked at ₹545.40.
Therefore, the chart has a clear difference between short-term support and deeper support.
| Price zone | Chart interpretation |
|---|---|
| ₹593–₹594 | Current decision area |
| ₹582.40 | Key support |
| ₹560 | Lower support area |
| ₹545.40 | Major horizontal support |
A break below ₹582.40 would not automatically mean that ₹560 or ₹545.40 will be reached. It would simply make those lower areas more relevant for further analysis.
RSI Review
The chart shows RSI (14, close) at 53.67. The RSI-based moving average is 57.35.
An RSI value near 50 is generally viewed as a neutral zone. A value of 53.67 is slightly above that midpoint. This means the RSI is not showing a clearly weak condition, but it also does not show very strong momentum.
The RSI is below its displayed average of 57.35. This suggests that recent momentum has cooled from the stronger levels seen earlier on the chart.
This fits the price structure. HINDZINC had a strong upward move, but the latest price action shows some loss of short-term strength.
The RSI is also far from the traditional overbought level near 70. It is not close to the traditional oversold area near 30 either.
| RSI measure | Value | Simple reading |
|---|---|---|
| RSI (14) | 53.67 | Neutral to mildly positive |
| RSI-based MA | 57.35 | Above current RSI |
RSI should not be used alone. A stock can remain above 50 while price still falls, and it can also remain below 70 during a strong upward move.
MACD Review
The chart shows MACD at 11.06 and a Histogram value of -1.03. The displayed MACD values are therefore still positive in absolute terms, but the histogram has moved below zero.
This combination suggests that the broader MACD structure remains positive while recent momentum has weakened.
The MACD lines on the chart had a stronger upward phase during the earlier price rise. The latest part of the indicator shows less strength.
That is consistent with the RSI data. Both indicators suggest that the strong momentum seen earlier has reduced.
This does not confirm a major bearish reversal. It simply gives a reason for caution if price fails to hold its nearby support zone.
Volume Review
The chart shows volume of 899.98K for the latest session.
Volume can help place a price move in context. A price move with strong volume may carry more technical significance than a similar move with very low volume.
The chart shows some large volume bars during the August price rise. The latest volume remains notable, but the image alone does not provide enough information to make a firm conclusion about long-term volume trends.
For a stronger technical signal, the price level and volume should be assessed together. For example, a move above ₹601.30 or ₹613.15 with strong volume could provide better confirmation than a move above those levels on weak volume.
Overall Technical Picture
The chart presents a neutral-to-bullish short-term picture and a bullish medium-term structure, subject to the support levels described above.
The positive side comes from the upward price structure from July into August, the position above ₹582.40, and the fact that the current price remains near the short-term moving average rather than far below it.
The cautious side comes from the RSI at 53.67, which is below its RSI-based MA at 57.35, and the MACD histogram at -1.03. These readings suggest that recent momentum is weaker than it was during the earlier upward move.
The most useful way to view the chart is therefore through price zones rather than through one fixed prediction.
| Scenario | Key level | Chart-based interpretation |
|---|---|---|
| Current zone | ₹593–₹594 | Important short-term decision area |
| Positive confirmation | Above ₹601.30 | Better short-term strength |
| Stronger confirmation | Above ₹613.15 | More positive structure |
| Higher resistance | ₹622.85 | Important upside reference |
| Prior high zone | Around ₹632 | Major resistance |
| Extension | ₹645.65 | Fibonacci extension |
| Higher extension | ₹663.00 | 161.8% extension |
| Main support | ₹582.40 | Key level for the current structure |
| Lower support | ₹560 | Next lower reference |
| Major support | ₹545.40 | Important horizontal support |
Risk-Based View
From a risk perspective, the most important issue is not whether the chart looks bullish or bearish in isolation. The more useful question is whether price respects or breaks the important levels.
A move above ₹601.30 would provide some evidence of renewed short-term strength. A move above ₹613.15 would provide stronger evidence. A move above the prior high area near ₹632 would further improve the technical structure.
In contrast, a move below ₹582.40 would weaken the current setup. A further move toward ₹560 and then ₹545.40 would indicate greater technical weakness.
This creates a relatively clear framework for chart observation without assuming that any outcome is certain.
Final Assessment
Based only on the chart, HINDZINC remains in a generally positive medium-term structure, but its short-term momentum has cooled.
The close at ₹593.20 is close to the 10-day SMA of ₹593.57 and the 23.6% Fibonacci level of ₹593.85. This makes the ₹593–₹594 area an important technical zone.
Above that area, ₹601.30, ₹607.30, and ₹613.15 are the main levels to watch. A sustained move above ₹613.15 would improve the short-term technical picture, while a move above the prior high area near ₹632 would place ₹645.65 and ₹663.00 on the chart as Fibonacci extension references.
On the downside, ₹582.40 is the key level. A daily close below it would weaken the present structure and make ₹560 and ₹545.40 more relevant support areas.
The indicators support a cautious view rather than an aggressive one. RSI at 53.67 is neutral to mildly positive, but it remains below its RSI-based MA of 57.35. MACD is at 11.06, while its histogram is -1.03, which points to weaker recent momentum.
In simple terms, the chart still has a positive structure, but it needs price confirmation. ₹593–₹594 is the main current decision zone, ₹601–₹613 is the key resistance area, ₹632 is a major prior high zone, and ₹582.40 is the main level that protects the current bullish structure.
This assessment is based solely on the chart supplied and should not be treated as a guarantee, forecast, or personalised investment recommendation.
ALSO READ: Fed September Rate Hike Odds Rise as CPI Takes Center Stage
10 FAQs About the HINDZINC Chart
1. What is the current HINDZINC price shown on the chart?
The chart shows a closing price of ₹593.20. The daily change is +₹4.80, or +0.82%.
2. Is the HINDZINC chart bullish or bearish?
The chart shows a generally positive medium-term structure, but short-term momentum has weakened. The price still holds above the key support at ₹582.40, which is important for the current setup.
3. What is the main support level for HINDZINC?
The main support shown on the chart is ₹582.40. A daily close below this level could weaken the current technical structure. Lower support areas are around ₹560 and ₹545.40.
4. What is the important resistance level?
The first resistance is ₹601.30. Other important levels are ₹607.30 and ₹613.15. The area near ₹610–₹613 is particularly important because the 10-day High SMA is also near this zone at ₹610.48.
5. What happens if HINDZINC moves above ₹613.15?
A sustained move above ₹613.15 could indicate stronger short-term price action. The next chart levels to watch would be ₹622.85 and then the previous high area near ₹632.
6. What are the higher Fibonacci levels on the chart?
The chart shows Fibonacci extension levels at ₹645.65 and ₹663.00. These are technical reference levels, not guaranteed price targets.
7. What does the RSI indicate?
The RSI is 53.67, while the RSI-based moving average is 57.35. This suggests a neutral-to-mildly positive condition, although momentum has cooled because RSI remains below its average.
8. What does the MACD indicate?
The chart shows MACD at 11.06 and a MACD histogram of -1.03. The positive MACD value supports the broader positive structure, while the negative histogram suggests weaker recent momentum.
9. Why is ₹593–₹594 important?
The current price of ₹593.20, the 10-day SMA of ₹593.57, and the 23.6% Fibonacci level of ₹593.85 are all close to one another. This makes ₹593–₹594 an important short-term decision zone.
10. What is the main risk level on this chart?
The main technical risk level is ₹582.40. A daily close below this level could weaken the current bullish structure. The next chart references would then be ₹560 and ₹545.40. These levels do not guarantee where the price will move next.
ALSO READ: Indian Stocks in Focus: News, Risks and Key Triggers