
Himadri Speciality Chemical Limited remained one of the most watched stocks in the specialty chemical space after a sharp rise in price and strong long-term returns. The company, which operates in the carbon black segment, has seen major investor interest due to business expansion, financial growth, and rising exposure to battery materials.
The stock touched a fresh 52-week high of ₹698 on 05 June 2026. This level also reflected strong market confidence after a long period of positive movement. Over the last five years, the stock delivered a return of 1,245.06 percent. Such a rise placed the company among the stronger performers in the small-cap segment.
The company currently holds a total market capitalization of ₹34,712.46 crore. Free float market capitalization stands at ₹16,106.83 crore. The stock remains part of the NIFTY SMALLCAP 100 index, which adds institutional visibility and stronger participation from large investors.
Short-Term And Long-Term Returns Stay Strong
Recent trading data shows positive movement across several time periods. The stock gained 13.45 percent during the last one week. Monthly returns came near 11.92 percent, while year-to-date gains stood at 41.74 percent.
The one-year return reached 38.35 percent. Over the last three years, the stock moved higher by 422.40 percent. Such performance reflects long-term market confidence in the company’s business direction and future opportunities.
At the same time, benchmark comparison numbers suggest that Himadri outperformed broader market indices in several periods. This often signals stronger investor demand compared to the overall market trend.
Although past returns do not guarantee future performance, strong historical growth usually attracts fresh investor attention. Stocks with high momentum often remain under market focus for extended periods.
Trading Volumes Reflect High Market Activity
The stock also recorded very strong trading activity. Traded volume reached 244.46 lakh shares, while traded value stood near ₹1,624.95 crore. High trading value usually reflects active participation from institutional investors, retail traders, and market participants.
Impact cost remained low at 0.05. A lower impact cost generally shows better liquidity in the stock. This allows large investors to enter or exit positions with lower price disturbance.
The company also reported deliverable quantity at 18.01 percent of total traded quantity. This number may indicate that a portion of market activity came from short-term trades rather than long-term delivery-based buying.
Still, high trading activity often reflects strong investor interest and increased market visibility.
Fresh High Signals Positive Sentiment
The stock touched its 52-week low at ₹418.50 on 24 November 2025. Since then, the price moved sharply higher and reached a fresh yearly high of ₹698.
Such a rise within a relatively short period suggests improving market sentiment toward the company. Investors usually track fresh highs closely because they often indicate positive momentum and stronger confidence in future business prospects.
The upper circuit band for the stock currently stands at ₹822.05, while the lower band remains at ₹548.05. The stock carries a daily volatility of 2.38 and annualized volatility of 45.47.
Higher volatility often means larger price movement within short periods. Such stocks can offer strong upside potential, but they may also witness sudden corrections during weak market phases.
Because of this, market experts usually advise investors to study both risk and reward before taking decisions.
ALSO READ: The Real Reason Why the Rupee Keeps Falling; How to Profit
Valuation Reflects Growth Expectations
Himadri Speciality Chemical currently trades at a price-to-earnings ratio of 42.90. Adjusted P/E also remains at the same level.
A higher P/E ratio often means that investors expect stronger future earnings growth. Markets sometimes assign premium valuations to companies linked with sectors that show long-term demand expansion.
In Himadri’s case, investor optimism partly comes from the company’s move toward battery materials, specialty chemicals, and advanced carbon products. These segments may offer better margins compared to traditional commodity businesses.
However, elevated valuation levels also increase pressure on future earnings performance. Companies with high P/E ratios usually need consistent profit growth to support market expectations.
If business expansion continues successfully, investors may remain positive. On the other hand, slower earnings growth or weak sector demand may affect sentiment.
Battery Material Expansion Changes Market View
One of the major reasons behind the stock re-rating comes from the company’s battery material business. Himadri entered the lithium-ion battery supply chain through anode material production.
This step changed how investors view the company. Earlier, the market mainly treated Himadri as a carbon black manufacturer. Today, many investors see it as a future-focused specialty materials company with exposure to electric vehicle demand.
The global electric vehicle sector continues to expand due to clean energy policies and rising battery demand. Companies linked with battery materials often receive strong investor attention because of expected long-term growth.
Himadri’s research work, specialty product focus, and production expansion helped support this positive outlook.
Specialty Business Supports Profit Growth
The company also expanded its specialty carbon black business through higher production capacity. Specialty products usually offer stronger margins and more stable demand compared to regular industrial chemicals.
This business transition may help the company improve earnings quality over time. Better product mix often supports profit expansion even during periods of raw material fluctuation.
Market participants usually prefer businesses with value-added products because such companies may achieve stronger pricing power and customer retention.
As a result, investor confidence improved after the company announced new projects and stronger operational performance.
Liquidity And Market Presence Stay Healthy
Himadri Speciality Chemical has remained listed since 02 March 2007. The stock trades actively in the market and maintains strong liquidity levels.
The face value of the share stands at ₹1. Applicable margin rate remains at 18.87 percent. These factors remain important for traders and derivatives market participants.
Inclusion in the NIFTY SMALLCAP 100 index also improves institutional participation because many funds track index-based investment strategies.
Higher institutional visibility often helps improve long-term market stability and investor confidence.
Investors Continue To Watch Future Expansion Plans
Market attention now remains focused on future business execution. Investors may closely track the company’s battery material expansion, specialty product demand, and earnings performance over the next few quarters.
The company’s move toward high-growth sectors created strong optimism. However, market experts generally advise caution because specialty chemical stocks may react sharply to changes in raw material prices, global demand, and economic conditions.
Future performance may depend on successful project execution, demand from EV-related sectors, and stable profit margins.
At current levels, the stock reflects both strong historical performance and future market expectations.
Stock Rally Keeps Market Focus On Himadri
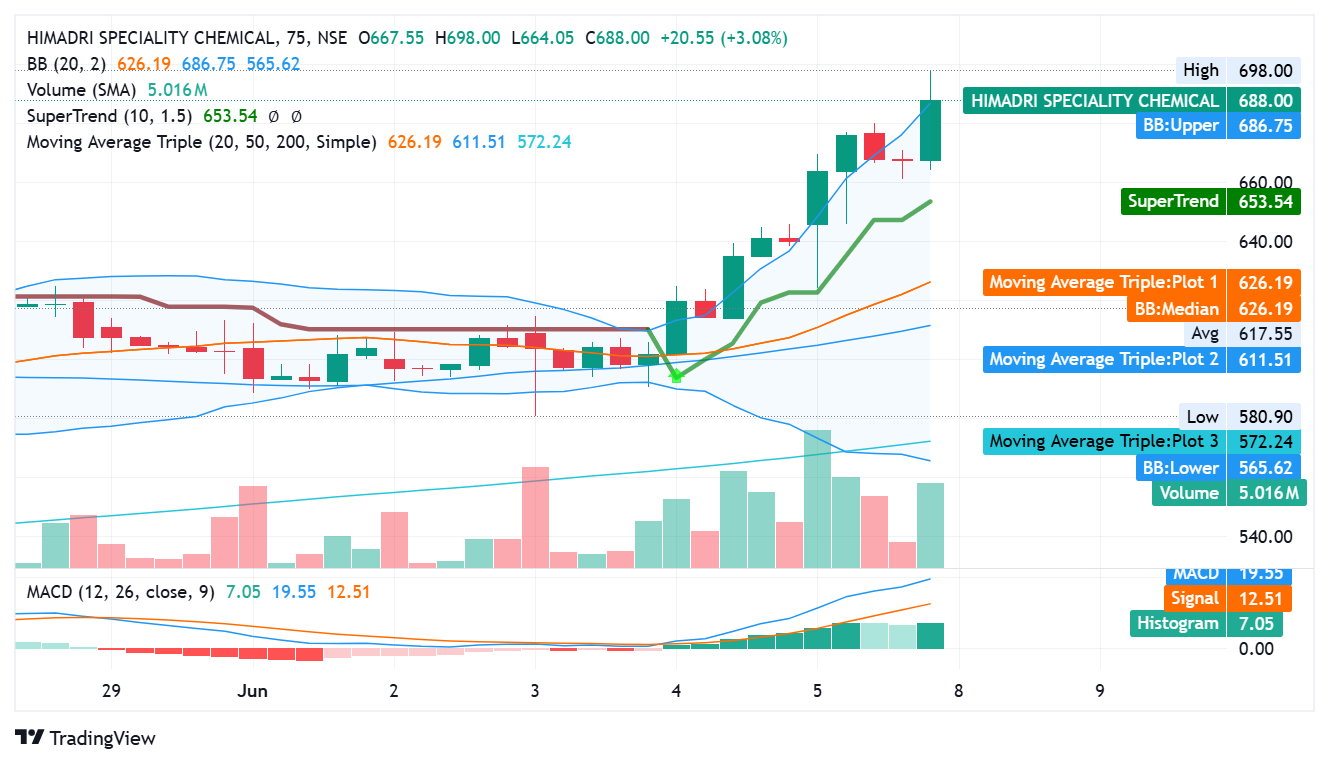
Himadri Speciality Chemical Limited remained under strong market focus after the stock touched a fresh 52-week high of ₹698. The share closed near ₹688 after a sharp upward move on the chart. Strong price action, high trading volume, and positive technical indicators supported bullish market sentiment during the session.
The stock belongs to the carbon black industry and remains part of the NIFTY SMALLCAP 100 index. Over the last few years, the company has moved from a traditional chemical business toward advanced specialty products and battery materials. This shift has helped improve investor confidence and market valuation.
Recent price movement also reflects stronger participation from traders and institutional investors. High market activity, positive trend signals, and steady financial growth have all supported the stock rally.
Technical Chart Shows Strong Uptrend
The chart reflects a clear upward trend in the stock price. Himadri Speciality Chemical traded near ₹667 during the session before it moved close to ₹698. The stock later settled around ₹688 with gains of more than 3 percent.
The price stayed above important moving averages, which often signals positive momentum in technical analysis. The 20-day moving average stood near ₹626.19. The 50-day moving average remained around ₹611.51, while the 200-day moving average came near ₹572.24.
When a stock trades above short-term, medium-term, and long-term averages at the same time, many traders view the trend as strong. This setup usually reflects positive market sentiment.
The chart also showed the stock above the SuperTrend level of ₹653.54. In technical analysis, this indicator often supports bullish momentum when the price remains above the trend line.
Bollinger Bands Reflect Strong Price Expansion
The Bollinger Band indicator on the chart also reflected strong price action. The upper band stood at ₹686.75, while the lower band remained near ₹565.62. The stock traded close to the upper band during the session.
In many cases, movement near the upper Bollinger Band may signal strong momentum and high buyer interest. At the same time, traders also watch such levels carefully because sharp rallies sometimes lead to short-term profit booking.
The Bollinger Band average stayed near ₹626.19. Since the stock traded much higher than this average, the market trend remained positive during the session.
Volume activity also increased sharply during the rise. The chart showed volume near 5.016 million shares. Higher volume during upward price movement often reflects stronger market participation.
ALSO READ: Will Bitcoin Slip to $40,000? Full Technical Analysis
MACD Indicator Supports Positive Sentiment
The MACD indicator also reflected bullish signals on the chart. The MACD line remained near 19.55, while the signal line stood around 12.51. The histogram remained positive at 7.05.
In technical analysis, positive MACD crossover patterns often suggest strong momentum and continued buyer interest. Rising histogram values may also support positive sentiment in the near term.
However, technical indicators only reflect market behaviour and not guaranteed future direction. Stock prices may react to several factors such as company performance, global trends, investor sentiment, and sector demand.
Because of this, market experts usually advise investors to combine technical study with financial analysis before any investment decision.
Strong Returns Across Multiple Time Frames
The stock has delivered strong returns across several periods. During the last one week, the share price gained 13.45 percent. Monthly return stood at 11.92 percent.
Year-to-date return reached 41.74 percent, while one-year return came near 38.35 percent. Over three years, the stock surged 422.40 percent. Five-year return touched an impressive 1,245.06 percent.
Such long-term performance reflects sustained investor confidence in the company’s business strategy and expansion plans.
Strong historical returns often attract fresh market attention. However, past performance does not guarantee similar future returns. Market conditions and company fundamentals may change over time.
High Trading Activity Reflects Investor Interest
Trade data showed very strong market participation in the stock. Traded volume reached 244.46 lakh shares, while traded value stood near ₹1,624.95 crore.
The company currently holds a total market capitalization of ₹34,712.46 crore. Free float market capitalization remained at ₹16,106.83 crore.
Impact cost stayed very low at 0.05, which usually reflects healthy liquidity in the counter. Lower impact cost often helps large investors enter or exit positions with less price disturbance.
The percentage of deliverable quantity compared to traded quantity stood at 18.01 percent. This may suggest that a notable portion of market activity came from short-term trading interest.
Still, strong volume and high liquidity generally support better market confidence.
Valuation Reflects Future Growth Expectations
Himadri Speciality Chemical currently trades at a symbol P/E ratio of 42.90. Adjusted P/E also remains at 42.90.
Higher valuation multiples usually indicate strong future growth expectations from investors. The market now views the company as more than a traditional carbon black manufacturer due to its battery material expansion and specialty chemical business.
Investors appear optimistic about future earnings potential linked with electric vehicle demand and advanced carbon products.
At the same time, higher valuations also increase pressure on future business execution. Market participants may closely watch earnings growth, project execution, and margin performance in coming quarters.
Volatility Remains Elevated
The stock currently carries daily volatility of 2.38 and annualized volatility of 45.47. Such numbers indicate larger price movement compared to stable blue-chip stocks.
Higher volatility may create both opportunity and risk for market participants. Sharp upward rallies may also see sudden corrections during weak market conditions or profit booking phases.
The upper price band currently stands at ₹822.05, while the lower band remains at ₹548.05. Tick size for the stock stays at ₹0.05.
Due to volatility, investors often prefer proper risk management and careful position sizing while dealing with fast-moving stocks.
Long-Term Story Keeps Investors Positive
The company’s move toward specialty materials and battery-related products remains one of the biggest long-term triggers behind investor optimism.
Global electric vehicle demand continues to rise, and battery material businesses may benefit from this trend over the next several years. Himadri’s presence in advanced carbon products and specialty chemicals may also support future earnings growth.
The market now views the company as a growth-oriented specialty materials player rather than only a commodity chemical manufacturer.
Future stock movement may depend on financial performance, sector demand, raw material prices, and successful expansion execution.
Frequently Asked Questions
Why did Himadri Speciality Chemical stock rise recently?
The stock gained due to strong technical momentum, high trading activity, and positive investor sentiment linked with specialty chemical and battery material growth.
What is the 52-week high of the stock?
The stock touched a 52-week high of ₹698 on 05 June 2026.
What does the MACD indicator show for the stock?
The MACD indicator remained positive, which often reflects bullish market momentum and stronger buyer participation.
Why do investors track moving averages?
Moving averages help traders understand market trend direction and price strength over different time periods.
Is Himadri Speciality Chemical a high-volatility stock?
Yes, the stock carries relatively high annualized volatility of 45.47, which means price movement may remain sharp during market sessions.