
Kirloskar Oil Engines Limited has seen a very sharp rise in stock price over the last few months. The company now stands among the strongest performers in the industrial and capital goods space. Market participants now watch the stock closely after a move that looks unusually strong when compared with normal sector behavior.
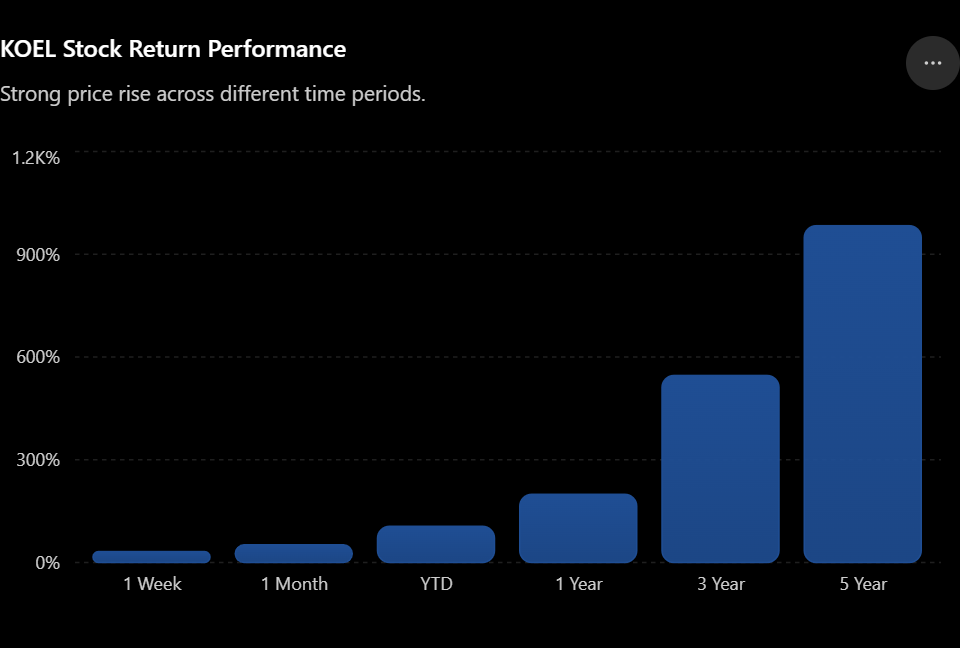
The stock gave a return of 31.97 percent in just one week. In one month, the return reached 51.52 percent. From the start of the year, the stock rose 105.76 percent. The one-year return now stands at 199.16 percent. Over three years, the stock moved 546.14 percent higher. Over five years, the stock delivered 983.40 percent.
Such price action usually attracts attention because this kind of move rarely comes without a major change in market expectations. A stock does not rise nearly ten times in five years without investors seeing stronger future business potential.
At present, the share trades near ₹2,530 after a gain of almost 5.9 percent during the latest session.
This kind of upward move suggests very strong positive sentiment around the company.
Market Value Has Expanded Significantly
The company now has a market capitalization of ₹34,757 crore according to exchange data, while earlier market data placed it near ₹36,723 crore based on price fluctuations during the trading session.
Enterprise value currently stands at ₹38,821 crore. This number gives a broader picture because it includes debt obligations along with market capitalization.
Kirloskar Oil Engines now sits comfortably inside the capital goods sector, with a business focus in engineering and industrial equipment.
The company remains a part of the NIFTY 500 index, which gives it wider institutional visibility.
This level of market value shows investors now place much higher confidence in the company compared with earlier years.
Valuation Looks Rich But Sector Comparison Gives Better Context
The stock now trades at a price-to-earnings ratio of 60.52. Earlier exchange numbers showed the P/E ratio near 62.29.
At first look, this number appears expensive.
However, the industry average P/E currently stands at 59.46.
This means the market does not value Kirloskar Oil Engines far above other comparable companies in the sector. In simple words, the company itself may not look excessively expensive when compared directly with peers.
Still, some caution remains necessary.
The price-to-book ratio now stands at 9.60, while the book value per share remains ₹249.02.
This means investors currently pay almost ten times the company’s accounting value.
Normally, such a premium appears only when investors expect stronger earnings growth in future years.
The PEG ratio now stands at 2.80.
This number often helps compare valuation against growth expectations. Lower numbers usually suggest better value. A PEG ratio above 2 often means future growth expectations already reflect strongly in the share price.
This does not automatically mean overvaluation, but it suggests limited room for valuation expansion without stronger earnings support.
ALSO READ: Tanla Near Key Breakout Zone: What Comes Next?
Unusual Volume Activity Has Created Strong Market Interest
One of the strongest signals in recent sessions came from unusual volume activity.
Recent data shows traded volume reached 77.59 lakh shares. Total traded value crossed ₹2,020 crore.
More importantly, stock volume rose 5.2 times above the recent five-day average.
This matters because volume often confirms whether price movement carries conviction.
Low volume rallies sometimes fail quickly.
High volume rallies often suggest stronger market participation.
In this case, volume expansion looks substantial.
Such numbers normally indicate that larger participants have entered the stock.
This creates stronger confidence in the sustainability of short-term price action.
Delivery Data Suggests Serious Buying Activity
The stock also showed a major rise in delivery volume.
Recent market data shows delivery volume moved 2.8 times above the recent five-day average.
Earlier exchange statistics showed deliverable quantity at 21.52 percent of traded quantity.
Normally, lower delivery percentages sometimes suggest speculative activity.
However, the recent surge in delivery volume creates a different picture.
A rise in delivery generally means investors choose to hold shares rather than exit within the same session.
This often suggests stronger conviction among buyers.
When high volume and higher delivery appear together, analysts usually view the move with greater confidence.
It may indicate participation from institutions, larger investors, or informed market participants.
This type of market behavior deserves attention because random retail activity usually does not create such sharp volume expansion.
Insider Purchase Has Added A Positive Signal
Recent exchange disclosures also showed insider purchase activity.
The data shows Madankumar Kotragouda Patil purchased 1,940 shares through market purchase.
At current market price near ₹2,530, this transaction value stands close to ₹49 lakh.
From a financial perspective, this amount remains very small when compared with the total market capitalization above ₹34,000 crore.
Because of this, the transaction itself may not change the company’s valuation outlook.
But insider purchases often matter for another reason.
When individuals close to company operations buy shares using personal funds, markets sometimes read it as confidence in future prospects.
This does not confirm future price appreciation.
Still, it creates a mild positive sentiment around the stock.
The size remains small, but the signal remains constructive.
Momentum Indicators Continue To Show Strong Strength
Recent technical indicators suggest that Kirloskar Oil Engines still holds strong upward momentum. The stock now sits in a zone where buyers continue to dominate price action, but some indicators now show that caution may become necessary in the near term.
One major signal comes from the Relative Strength Index, commonly called RSI. Market data shows RSI has crossed above the 70 mark.
This level often attracts attention because it suggests the stock has entered what traders usually call an overbought zone.
In simple terms, the stock has moved upward very quickly.
This does not automatically suggest weakness ahead.
Sometimes strong stocks remain above this level for long periods.
Still, when RSI crosses above 70 after a large rally, analysts usually begin to watch for short-term exhaustion.
The stock remains technically strong, but risk starts to rise when momentum moves too far above historical averages.
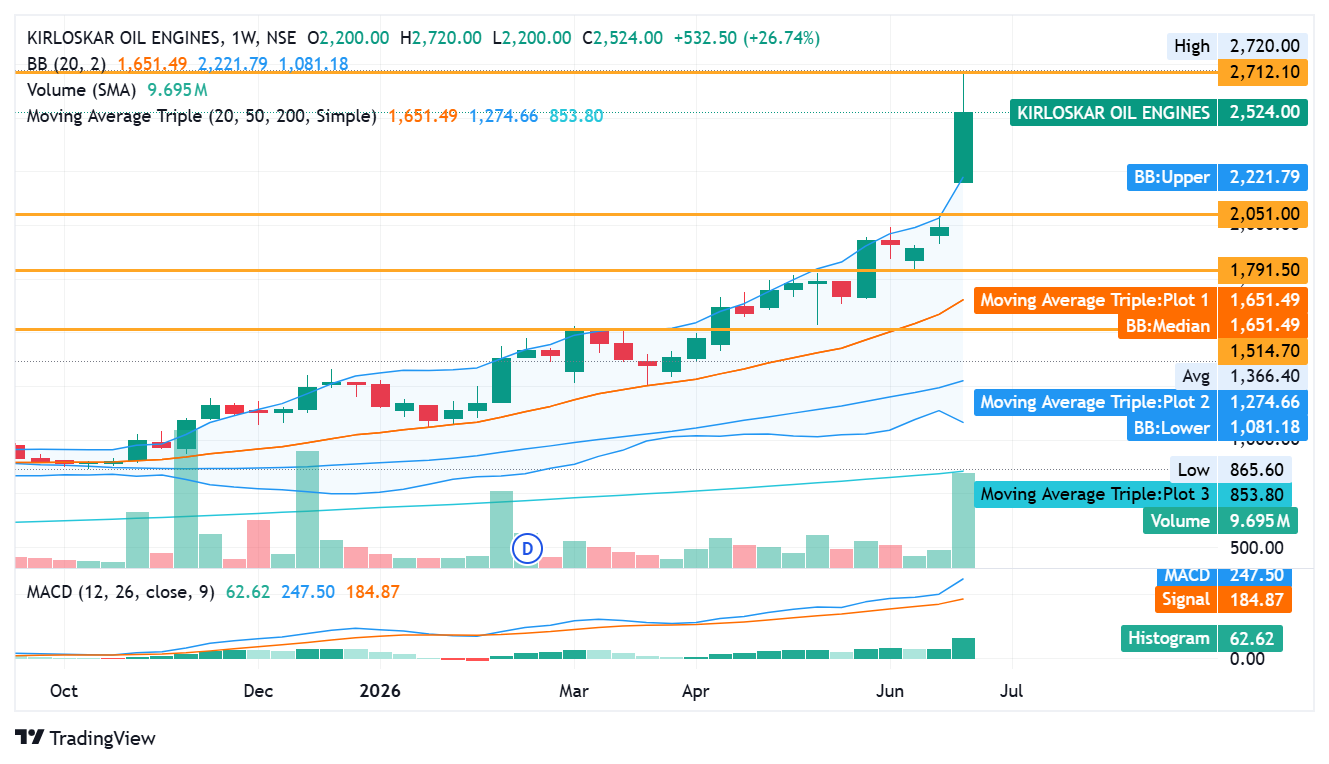
Weekly Price Structure Reflects Exceptional Demand
The latest weekly chart presents one of the strongest bullish structures visible in recent months.
The stock opened near ₹2,200 during the week. It then touched a high of ₹2,720. The lowest point stayed near ₹2,200. The week finally closed at ₹2,524.
This means the stock gained ₹532.50 during the week.
In percentage terms, this equals a rise of 26.74 percent in only one week.
For a company with market capitalization above ₹34,000 crore, this kind of movement is unusual.
Large companies usually move slower because higher capital is necessary to push prices sharply upward.
When such a move appears in a company of this size, analysts often begin to study whether larger institutions have entered the stock.
This price structure suggests very strong demand.
The market currently shows no major sign of selling pressure.
ALSO READ: Big Stock Market Updates You Can’t Ignore Today
Bollinger Bands Suggest Price Has Moved Far Above Normal Range
Another technical indicator now gives an important signal.
The Bollinger Band indicator shows the stock has moved sharply above its upper volatility range.
Current Bollinger levels show the upper band near ₹2,221.79.
The stock currently trades around ₹2,524.
This means price now stands significantly above its expected short-term volatility range.
Normally, stocks remain inside these bands during regular market behavior.
When price moves sharply outside the upper range, two possible outcomes usually appear.
The first possibility is continuation of breakout momentum.
The second possibility is temporary profit booking because the stock has moved too fast.
Neither outcome can be confirmed immediately.
However, technical analysts usually treat such expansion carefully because the stock has already stretched far beyond its normal trading zone.
Moving Average Structure Remains Extremely Healthy
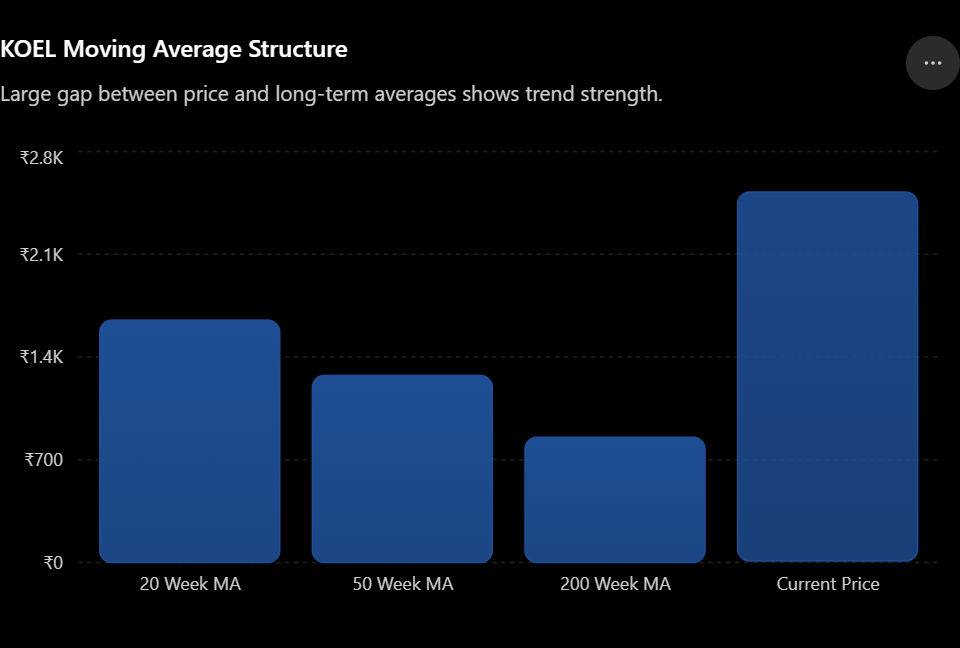
The chart also shows a very strong moving average structure.
The 20-week moving average now stands at ₹1,651.49.
The 50-week moving average stands at ₹1,274.66.
The 200-week moving average stands near ₹853.80.
Current price remains close to ₹2,524.
This means the stock trades nearly 53 percent above the 20-week average.
It stands almost 98 percent above the 50-week average.
It remains nearly 195 percent above the 200-week average.
This gap tells analysts one important thing.
Long-term trend remains extremely strong.
Stocks rarely maintain this type of separation unless strong demand enters over many months.
From a pure trend perspective, technical structure remains very healthy.
However, such distance from average price can also create temporary correction risk.
Markets usually return toward equilibrium after sharp expansion.
Volume Pattern Supports The Bullish Case
Volume behavior often confirms whether a price rally carries conviction.
Current weekly volume now stands at 9.695 million shares.
This volume level stands far above earlier activity.
Earlier exchange data already showed traded volume at 77.59 lakh shares with traded value above ₹2,020 crore.
Price expansion without volume often lacks reliability.
This case looks different.
Higher price and larger volume together usually indicate stronger market confidence.
Retail investors alone rarely create this type of broad participation.
Because of this, some analysts may interpret recent movement as a sign of serious capital entering the stock.
This does not guarantee future upside.
But it strengthens confidence in the current rally.
ALSO READ: Key Stock Updates Keep Indian Market In Positive Zone
MACD Indicator Shows Momentum Has Not Weakened
Another technical indicator confirms strength.
Current MACD data shows the MACD line at 247.50.
The signal line stands at 184.87.
The histogram now remains positive at 62.62.
This matters because MACD helps measure market momentum.
When the MACD line stays above the signal line, bullish momentum usually remains intact.
The distance between these two lines has widened further.
This often suggests stronger upward momentum rather than weakness.
If price momentum had begun to slow, the two lines would move closer.
That signal does not appear yet.
At present, momentum remains positive.
No major reversal signal appears on this chart.
Short Term Risk Has Begun To Rise
Despite strong bullish signals, risk now deserves attention.
The stock recently touched a 52-week high at ₹2,720.
The 52-week low remains ₹828.15.
This means price has moved more than three times higher within one year.
Such sharp expansion often creates emotional buying near market peaks.
This is where risk begins to increase.
Another concern comes from distance between current price and average historical trading zone.
The average price zone on the chart remains close to ₹1,366.
Current market price stands near ₹2,524.
This gap appears unusually large.
Stocks rarely move vertically forever.
After major rallies, temporary correction often follows.
A 10 to 15 percent decline after such expansion would still remain technically normal.
This does not mean trend weakness has begun.
It simply means fresh entry now carries more risk than earlier months.
Market May Be Pricing Future Expectations
When all available signals come together, a larger pattern becomes visible.
Strong insider purchase activity.
Large volume expansion.
Higher delivery percentage compared with recent average.
White Marubozu bullish candle.
Weekly gain of 26.74 percent.
Price far above Bollinger upper band.
MACD expansion.
RSI above 70.
Strong separation above long-term moving averages.
This combination often appears when the market expects a future business trigger.
Sometimes markets react before public information fully spreads.
This may reflect stronger earnings expectations, possible business expansion, sector rerating, or institutional accumulation.
No public conclusion can be confirmed from technical data alone.
However, recent price behavior clearly suggests the market has placed strong confidence in the company.
Final Analytical View
Kirloskar Oil Engines currently shows one of the strongest technical structures visible in the industrial sector.
Long-term trend remains strong.
Momentum remains positive.
Volume confirms conviction.
Institutional participation appears possible.
At the same time, valuation remains rich and short-term overheating risk has increased.
The stock does not currently show weakness.
However, price has moved far above historical equilibrium.
This suggests future upside may continue, but short-term volatility may also rise.
From an analytical perspective, the company currently remains in a strong bullish phase, though market participants may now watch carefully for correction or consolidation after such rapid expansion.
Disclaimer
This article is for informational and educational purposes only and reflects an analytical interpretation of publicly available market data, technical indicators, and trading activity related to Kirloskar Oil Engines Limited. The observations shared here should not be considered financial advice, investment advice, stock recommendation, or a suggestion to buy, sell, or hold any security. Stock market investments carry risk, and price movement can change rapidly due to market conditions, company developments, sector trends, or broader economic factors. Readers should conduct their own research and consult a qualified financial advisor before making any investment decision. Past performance, technical patterns, and market indicators do not guarantee future returns. The analysis presented here represents an independent market view based on available data at the time of writing.
Frequently Asked Questions
Is Kirloskar Oil Engines currently in a bullish trend?
Yes. Current technical indicators suggest a strong bullish trend with price above key moving averages and momentum indicators showing strength.
Why is RSI above 70 important?
RSI above 70 usually suggests the stock has moved upward very quickly and may enter a short-term overbought zone.
Does high volume confirm strength in the stock?
Usually yes. Large volume during price expansion often suggests stronger market conviction behind the move.
Is the stock currently expensive?
The stock trades at P/E near 60.52, close to industry P/E of 59.46, but Price to Book at 9.60 suggests premium valuation.
Can the stock face correction after this rally?
Yes. After a move from ₹828.15 to above ₹2,500 within one year, short-term correction of 10 to 15 percent would remain technically normal.