
HDFC Bank has come back into focus after a series of unusually large transactions on the National Stock Exchange. The stock saw twenty-five block trades with total value above ₹888 crore, a development that naturally caught market attention because transactions of this size usually involve institutional participants such as mutual funds, insurance firms, foreign investors, or large financial entities.
A block trade does not immediately indicate bullish or bearish sentiment. It simply shows that a large transfer of ownership took place between parties with substantial capital. The true meaning comes later, once price behavior reveals whether buyers absorb supply comfortably or whether heavy selling pressure starts to dominate.
To understand the possible direction, it becomes necessary to combine the news event with price action, volume behavior, moving averages, Bollinger Band positioning, and momentum indicators. When all of these pieces come together, a clearer market picture starts to emerge.
At present, HDFC Bank appears to stand at an important technical decision point.
Price Action Shows Strong Recovery From Lower Levels
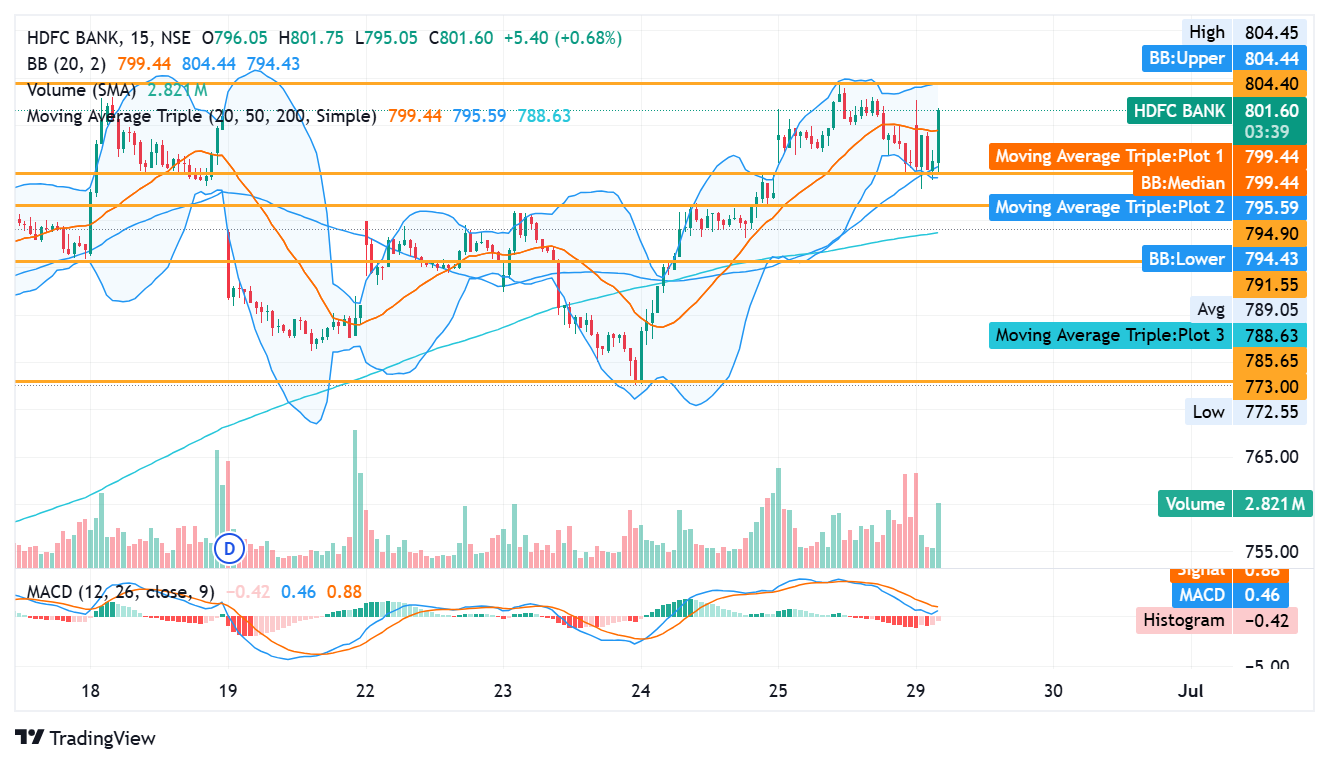
On the 15-minute chart, HDFC Bank closed at ₹801.60, which marks a gain of ₹5.40 or 0.68 percent for the session.
The most important observation comes from the sharp rebound after price touched the lower region near ₹794.
Earlier in the session, sellers pushed price lower toward this zone. Instead of further decline, buyers entered aggressively and pushed the stock upward toward ₹801.
This reaction matters because it shows demand emerged exactly where price approached an important support region.
When a stock falls and immediately recovers from a technical zone, it often means buyers still hold conviction and do not allow deeper weakness.
At this stage, price action suggests that short-term market control has shifted from sellers toward buyers.
Block Deal Activity Creates Institutional Interest
The news around ₹888 crore worth of block deals adds another important layer to this analysis.
Institutional transactions of this scale rarely happen randomly. Large participants usually execute such deals as part of portfolio allocation decisions, stake adjustments, or strategic positioning.
What stands out here is the market reaction.
If such large transactions had represented aggressive unloading, the stock could have shown immediate weakness. Instead, price held important support and moved upward during the same period.
This behavior suggests that available supply found willing buyers.
The market therefore did not treat the event negatively.
While exact buyer and seller details remain unknown, the price reaction indicates that institutional absorption may have taken place rather than panic-driven selling.
That creates a constructive backdrop.
Price Reclaims Important Moving Averages
One of the strongest technical observations comes from the moving average structure.
The chart shows three important averages.
The 20-period moving average stands near ₹799.44.
The 50-period moving average stands near ₹795.59.
The 200-period moving average stands near ₹788.63.
During weakness, price moved below short-term averages. Soon after, buyers pushed the stock back above both the 20-period and 50-period moving averages.
This matters because moving averages often act as dynamic support and resistance zones.
Once price moves above short-term averages after a decline, market sentiment usually improves.
The recovery above ₹799.44 particularly carries importance because this zone acted as resistance earlier.
It now begins to behave as support.
As long as price stays above these levels, short-term structure remains constructive.
Immediate Resistance Appears Near ₹804
The most important level on the chart sits near ₹804.40 to ₹804.45.
This zone carries technical importance for multiple reasons.
First, the session high stands at ₹804.45.
Second, the upper Bollinger Band stands near ₹804.44.
Third, price already approached this area several times but has not established a clean breakout.
When multiple technical signals align around one level, that area often becomes a major decision zone.
At present, buyers continue to test this ceiling.
If price crosses this level decisively and remains above it, market participants may interpret the move as a breakout confirmation.
If price fails again, temporary consolidation may follow.
The next few candles therefore become important.
Bollinger Band Structure Signals Momentum Expansion
Bollinger Bands help measure volatility behavior.
The chart currently shows:
Upper Band near ₹804.44
Middle Band near ₹799.44
Lower Band near ₹794.43
Price recently moved from the lower band region around ₹794 and quickly approached the upper band near ₹804.
This rapid movement often signals volatility expansion.
Volatility expansion usually happens when one side gains temporary control over the market.
In this case, buyers clearly took charge after defending lower levels.
However, another interpretation also exists.
When price reaches the upper Bollinger Band quickly, short-term overextension sometimes appears.
This can lead to temporary pullback before another upward move begins.
The stock therefore sits at an interesting technical balance.
Momentum looks strong, but immediate resistance remains active.
Support Structure Remains Well Defined
Support zones below current price look relatively strong.
The first important support sits near ₹799.44.
This level aligns with the middle Bollinger Band and the short-term moving average.
Since price already reclaimed this zone, buyers now need to defend it.
The second major support sits near ₹795.59.
This region corresponds with the 50-period moving average and previous reversal zone.
A deeper support level appears near ₹794.43.
This zone previously attracted aggressive buying interest.
Below this level, the structure begins to weaken.
The long-term dynamic support stands near ₹788.63, where the 200-period moving average currently rests.
A move toward this level would signal loss of short-term momentum.
At present, buyers maintain control because price remains comfortably above support clusters.
MACD Reveals Momentum Has Not Fully Confirmed
While price action looks positive, the MACD indicator presents a more cautious picture.
The current readings show:
MACD at 0.46
Signal Line at 0.88
Histogram at -0.42
The important detail here comes from the relationship between the MACD line and signal line.
The MACD line still remains below the signal line.
The histogram also stays negative.
This means momentum confirmation has not fully arrived despite the visible price recovery.
In simple terms, price strength has appeared faster than momentum strength.
Sometimes this happens before a proper breakout.
Other times it signals a temporary bounce that loses strength soon after.
The indicator therefore asks traders to remain cautious.
A bullish crossover would improve confidence significantly.
Until then, momentum confirmation remains incomplete.
Volume Supports Recovery But Conviction Stays Moderate
Volume often reveals whether buyers carry conviction.
The chart shows current traded volume near 2.821 million shares.
The recovery from lower levels near ₹794 came with decent participation.
This indicates real buying activity rather than weak speculative movement.
However, one concern remains.
Recent upward candles do not show explosive volume expansion.
This means buying interest exists, but exceptionally strong conviction does not appear yet.
A true breakout above resistance often requires heavier participation.
Without stronger volume, breakouts sometimes fail quickly.
For this reason, volume behavior near ₹804 becomes critical.
If price crosses resistance with expanding volume, confidence improves sharply.
If volume stays muted, caution becomes necessary.
ALSO READ: Vijaya Diagnostic Sees ₹15.29 Crore NSE Block Trade Deal
Institutional Activity and Technical Structure Align Positively
The most interesting part of this setup comes from the combination of fundamental market activity and technical behavior.
Large block deals worth ₹888 crore entered the market.
Normally, such activity creates uncertainty.
Yet despite these massive transactions, price held support near ₹794 and recovered toward session highs.
This behavior tells an important story.
Supply entered the market.
Demand absorbed supply successfully.
The stock did not experience panic selling.
Technical recovery began immediately after institutional activity became visible.
This combination usually suggests that stronger hands may have entered the market.
While certainty never exists in financial markets, current evidence supports a relatively constructive interpretation.
Breakout Scenario Above ₹804
The strongest bullish scenario begins if price establishes a sustained move above ₹804.45.
This level currently acts as the immediate ceiling.
A successful breakout would mean buyers defeated short-term resistance.
In that case, the next zones market participants may watch sit near ₹808, followed by ₹812, with a possible extension toward ₹815.
The reason this scenario matters comes from market psychology.
Repeated tests near resistance usually weaken seller confidence.
Eventually, buyers overpower supply.
If this happens alongside stronger volume expansion, momentum may accelerate quickly.
The stock therefore sits very close to an important breakout zone.
Consolidation Scenario Between ₹799 and ₹804
A second scenario involves sideways movement.
If price fails to break resistance but remains above support near ₹799, the stock may enter consolidation.
This means buyers and sellers temporarily reach balance.
Such periods often allow indicators like MACD to stabilize before the next directional move begins.
This outcome would remain neutral rather than bearish.
Consolidation after a strong upward recovery often serves as market preparation for the next move.
In simple terms, the stock may pause rather than reverse.
Weakness Scenario Below ₹794
The bearish scenario becomes relevant only if price falls below ₹794.
This support already proved its importance earlier.
If sellers push the stock below this zone again, market confidence may weaken.
Under such conditions, downside pressure may extend toward ₹791.55.
A deeper decline may test the 200-period moving average near ₹788.63.
This would suggest buyers failed to maintain control after institutional activity.
At present, this remains the weaker probability scenario.
Still, it cannot be ignored.
ALSO READ: HFCL Sees Major NSE Block Trades at Rs. 204.25 Share